.406 Ventures
Also known as Point 406 Ventures
Boston, United States 406ventures.com Boston ecosystem (#4 of 32)
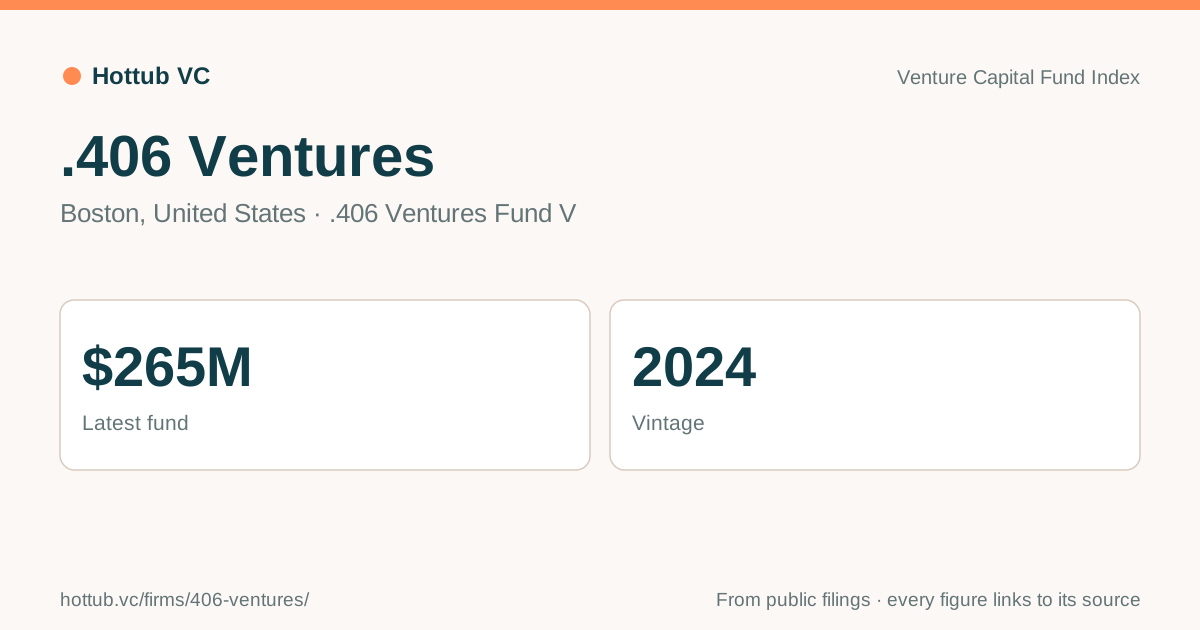
.406 Ventures’s latest fund is .406 Ventures Fund V: $265M, 2024, #153 of 427 firms by latest fund.
The numbers
| Year | Raised |
|---|---|
| 2015 | $217M |
| 2019 | $294M |
| 2024 | $265M |
Updates from .406 Ventures
Overview
Has raised more than US$1.4B across five core funds and three opportunity funds (2024).
Funds
| Fund | Closed | Size | Source |
|---|---|---|---|
| .406 Ventures Fund V | 2024 | $265M | techcrunch.com |
| Point 406 Ventures IV | 2019 | $294M | pulse2.com |
| .406 Ventures Fund III | 2015 | $217M | techcrunch.com |
LPs on the record
3 private foundations list on their latest IRS Form 990-PF, and 8 other LPs report holding .406 Ventures’s funds.
- Franklin Lexington Private Markets Fund
- Shear Family Foundation Inc
- Ascension Healthcare Master Pension Trust
8 more LPs are in the app. Find LPs that back firms like this one in Hottub’s LP Intelligence: ranked by overlap, with what each holds and how to reach it.
Firms whose LPs overlap
The firms sharing the most LPs on record with .406 Ventures, relative to how many LPs each has. A peer set like this is what Find LPs ranks LPs from.
- Accomplice
- Valhalla Partners
- August Equity LLP
- Catalyst Investors, L.L.C.
- Pioneer Square Investment Advisor, LLC
- Felicis
Find LPs for .406 Ventures and these firms: Hottub ranks the LPs that hold their funds, the ones still adding funds first.
Track record
A score of 50 out of 100 from its one fund public LPs report, in the bottom half of its vintage. Its ranked funds’ median TVPI is 1.49x and median DPI 1.36x. Pooled where reports give cash flows: 1.49x TVPI, 1.36x DPI. That ranks it 69th of 123 managers with a score.
Each fund once, as the latest of one LP’s reports ranks it by TVPI against funds of the same vintage in those reports; 50 is the median fund, and a short record is pulled toward 50. The full record in LP Intelligence, with each fund’s rank and what usually follows a fund like its latest, or every manager’s.
Reported fund performance
As reported by public LPs that invested in these funds, net of fees. “Versus vintage” ranks each fund against every other fund of the same vintage in that LP’s report, mostly private equity and venture funds. Open a fund for its cash flows and full peer ranking.
| Fund | Vintage | Net IRR | Versus vintage (IRR) | TVPI | DPI | Reported by |
|---|---|---|---|---|---|---|
| Point 406 Ventures I | 2006 | 5.8% | 1.49x | 1.36x | Employees' Retirement System of Rhode Island (ERSRI) |
Employees' Retirement System of Rhode Island (ERSRI): ERSRI Private Equity Performance - Active Portfolio (Rhode Island State Investment Commission book), as of March 31, 2026. "Net IRR (%)" and "Net Multiple of Investment" as printed in the Rhode Island State Investment Commission's monthly book, which says the multiple divides cumulative distributions and current value, after fees, by the capital paid in, and that the calculations are specific to the ERSRI investment and were not prepared, reviewed or approved by the general partners. 12 recent commitments are marked N/M (not defined in the report) and have no IRR or multiple. The book prints the listing twice (sorted by vintage year and by name); the two printings give a different Net IRR and multiple (a figure in one, N/M in the other) for Wynnchurch Capital Partners VI, which is left blank. The net multiple is used as TVPI; contributions are the Amount Drawn column, total value = Amount Distributed + Valuation and DPI = Amount Distributed / Amount Drawn are computed, in whole dollars as printed. 11 funds have a commitment printed in a foreign currency rather than dollars; for 7 of them the printed multiple does not equal (distributed + valuation) / drawn, and the report's "Total (in USD)" exceeds the sum of its rows by $43,302,434 drawn and $48,104,368 distributed, so the drawn and distributed columns of these rows do not appear to be in US dollars. For all 11, the commitment, contributions, distributions, total value and DPI are left blank and only the vintage, Net IRR and net multiple are imported. The report prints 1 row twice with identical figures (Industry Ventures Partnership Holdings IV - Secondary); it is imported once. All rows of the Private Equity Performance - Active Portfolio listing as classified by ERSRI (77 Buyout, 1 Fund of Funds, 10 Growth Equity, 4 Opportunistic Credit, 19 Venture Capital); the separate Private Credit, Real Estate and Private Infrastructure listings are not imported. The listing covers the active portfolio only, and its "Other Funds in Aggregate" row ($25,000,000 committed to funds whose confidentiality provisions do not permit disclosure of their performance) is not imported. The report's "Total (in USD)" row ($3,050,786,312 committed, $2,015,747,862 valuation) converts the foreign-currency commitments and does not reconcile exactly to the listed rows. The book's Portfolio Summary counts 121 private equity investments behind that total while the listing prints 112 rows, so the total also covers commitments that are not listed. View source
About this data
Fund sizes come from firm announcements, SEC filings, and press reports, converted to US dollars near the closing date. Compiled as of October 9, 2026. Notable portfolio companies are examples from public sources, not a complete list.
Share this page
For a post, a deck, or a note to your partners: image (PNG) · vector (SVG).