What happens after a raise
How often a venture fund is followed by the next, and a company raises again or goes public: base rates from every Form D since 2009.
- Plan for the next fund. How often a Fund I, II, or III was followed by another within two to six years.
- Read a startup’s odds. How often companies raised again within one to five years, and went public within ten, by sector.
- Know how far to trust them. Each rate is remade from earlier years and checked against what later ones did.
20% of 5,886 Fund Is first filed since 2009 had a next fund within four years
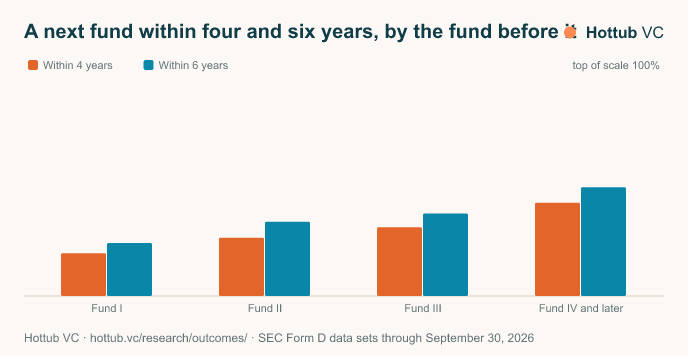
The numbers
| Fund before | Within 4 years | Within 6 years |
|---|---|---|
| Fund I | 20% | 25% |
| Fund II | 28% | 35% |
| Fund III | 32% | 39% |
| Fund IV and later | 44% | 51% |
Venture funds: a next fund
How often a manager filed its next fund, by the number of the one before, among 54,316 venture funds that first filed a Form D from 2009. A next fund is the same family’s next one, filed at least nine months later. Small numbers are the 95% interval.
| Fund before | Funds | Within 2 years | 3 years | 4 years | 6 years |
|---|---|---|---|---|---|
| Fund I | 5,886 | 8% | 15% | 20% | 25% |
| Fund II | 7,229 | 13% | 21% | 28% | 35% |
| Fund III | 3,167 | 13% | 24% | 32% | 39% |
| Fund IV and later | 5,284 | 24% | 36% | 44% | 51% |
| Unnumbered | 32,750 | 9% | 12% | 13% | 16% |
| Every venture fund | 54,316 | 11% | 16% | 20% | 24% |
By fund size, from under $25M to $500M and up: the Outlook in LP Intelligence.
Companies: raising again and going public
Each of 151,003 operating companies from its first Form D, by sector. Raising again is a new Form D at least four months later; going public is a final prospectus (an IPO or a direct listing). Public buyers’ 8-K reports name 211 of these companies as bought, too few for a rate: private buyers file nothing, and a buyer must name the company exactly as its Form D does. Those are in Recent exits, and leave the going-public count once bought.
| Sector | Companies | Raised again in 1 year | 3 years | 5 years | Public in 5 years | 10 years |
|---|---|---|---|---|---|---|
| Software and IT | 33,495 | 13% | 36% | 40% | 0.6% | 1% |
| Biotech and pharma | 6,293 | 15% | 44% | 51% | 6% | 8% |
| Health care | 8,687 | 11% | 30% | 35% | 0.8% | 2% |
| Energy and climate | 6,671 | 10% | 21% | 23% | 0.4% | 0.5% |
| Financial services | 8,739 | 7% | 17% | 20% | 0.4% | 0.8% |
| Consumer | 6,498 | 7% | 18% | 20% | 0.1% | 0.4% |
| Industrial and business services | 7,413 | 9% | 23% | 26% | 0.3% | 0.5% |
| Real estate | 38,857 | 1% | 3% | 4% | 0% | 0.1% |
| Other | 34,350 | 10% | 24% | 27% | 0.4% | 0.6% |
| Every company | 151,003 | 8% | 22% | 25% | 0.6% | 1% |
Companies that went public did so a median 3.4 years after their first Form D on record. By the size of the first raise, and each sector by size: the Outlook in LP Intelligence.
Recent exits
The latest companies here to go public or be acquired, with the years since their first Form D on record.
| Company | Exit | Sector | Years | Date |
|---|---|---|---|---|
| Bambusa Therapeutics, Inc. | Went public | Biotech and pharma | 1.8 | October 30, 2026 |
| GEORGIA BANKING CO INC | Went public | Financial services | 5.6 | October 29, 2026 |
| Lycia Therapeutics, Inc. | Went public | Biotech and pharma | 6.6 | October 23, 2026 |
| Iambic Therapeutics, Inc. | Went public | Biotech and pharma | 3.0 | October 15, 2026 |
| Retension Pharmaceuticals, Inc. | Went public | Biotech and pharma | 2.8 | October 9, 2026 |
| ADARx Pharmaceuticals, Inc. | Went public | Biotech and pharma | 6.6 | September 28, 2026 |
| Vesicor Therapeutics, Inc. | Went public | Biotech and pharma | 3.0 | September 22, 2026 |
| Electra Therapeutics, Inc. | Went public | Biotech and pharma | 0.9 | September 18, 2026 |
| Verdera Energy Corp. | Went public | Energy and climate | 0.5 | September 15, 2026 |
| LEGGETT & PLATT INC | Acquired by SOMNIGROUP INTERNATIONAL INC. | Industrial and business services | 8.9 | August 26, 2026 |
How well these rates predict
Each rate was made again from earlier years only, then checked against what later companies and funds did. The Brier score is the mean squared error of those predictions; lower is better.
- Raised again within 3 years. Made from first Form D in 2009–2015, checked on first Form D in 2016–2021 (54,453): 12% closer to what happened than one rate for everyone (Brier 0.1459 against 0.1664). Later years came out about where these rates said.
- A next venture fund within 4 years. Made from funds first filed in 2009–2016, checked on funds first filed in 2017–2021 (15,520): 12% closer to what happened than one rate for everyone (Brier 0.1517 against 0.1730). Later years came out about where these rates said.
- Went public within 7 years. Made from first Form D in 2009–2012, checked on first Form D in 2013–2018 (50,123): 7% closer to what happened than one rate for everyone (Brier 0.0063 against 0.0068). Later companies and funds did it less often than these rates said, so read them as an upper bound for recent years.
Each band’s predicted and observed rates: the Outlook in LP Intelligence.
How these rates are made
Sources: the SEC’s Form D data sets from 2009 through September 30, 2026, EDGAR’s full index of filings since 1993 for prospectuses, and public buyers’ 8-K reports of completed acquisitions. Funds, SPACs, trusts, REITs, and banks’ holding companies aren’t counted as companies; a pooled investment fund is a venture fund when its Form D says so.
Each company and fund is followed from its first Form D until the event or the data’s last day, so a recent one counts for as long as it has been watched (Kaplan–Meier). Going public is a cumulative incidence (Aalen–Johansen), with a company bought first counted out: it can’t list later. Intervals are Greenwood’s 95%; a rate is left out where fewer than twenty were still followed that long.
A company counts as acquired only when a public buyer’s 8-K (Item 2.01) names it exactly as one company that filed a Form D before it. Private buyers file nothing, so most acquisitions aren’t on the record, and no acquisition rate is given. A company that went public only by filing an annual report, without a prospectus, isn’t counted: those are mostly shells. These are histories of groups, not a forecast for any one company or fund, and not investment advice. 1,160 companies went public in these records, and public buyers’ 8-Ks name 211 as acquired.
Data feed: the rates on this page (CSV). Free to use with a link to this page. Managers’ track records from their LPs’ reports, and how each LP invests, are in LP Intelligence.