Menlo Ventures
Also known as Menlo
Menlo Park, United States Founded 1976 menlovc.com San Francisco Bay Area ecosystem (#1 of 32)
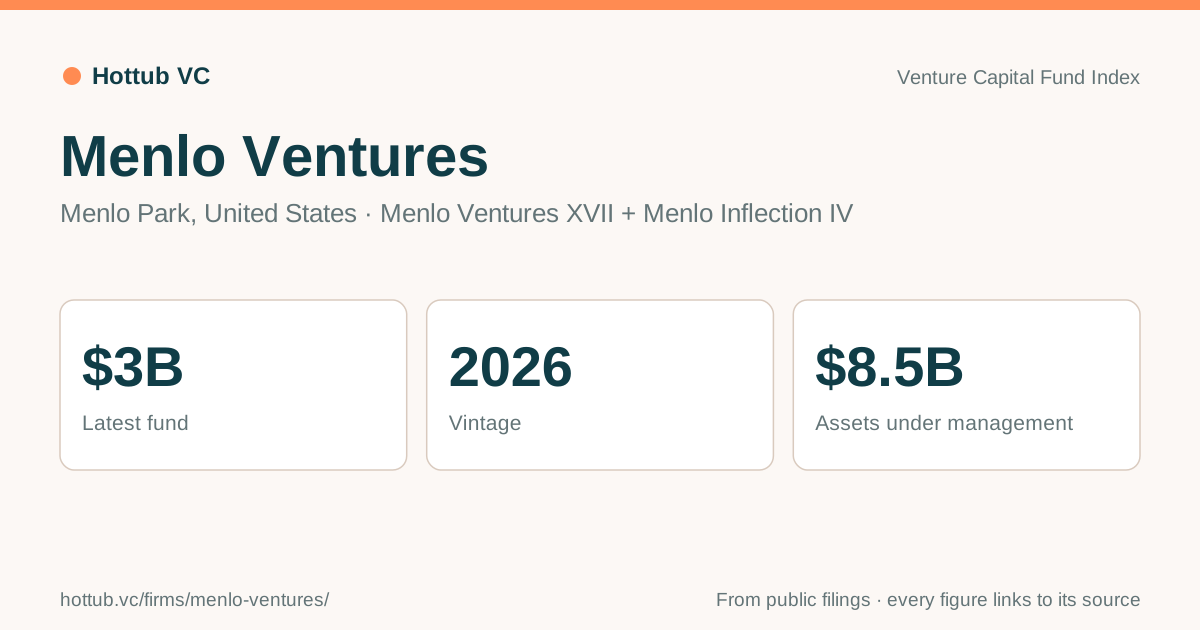
Menlo Ventures’s latest fund is Menlo Ventures XVII + Menlo Inflection IV: $3B, 2026, #19 of 427 firms by latest fund.
Updates from Menlo Ventures
Overview
AUM reported as 'more than $8.5B'. Founding year is inferred from the 2026 '50 years' announcement.
Notable portfolio companies
Funds
| Fund | Closed | Size | Source |
|---|---|---|---|
| Menlo Ventures XVII + Menlo Inflection IV | 2026 | $3B | globenewswire.com |
LPs on the record
5 private foundations list on their latest IRS Form 990-PF, and 11 other LPs report holding Menlo Ventures’s funds.
- Washington State Investment Board
- State of Michigan Retirement System (SMRS)
- New Mexico State Investment Council
13 more LPs are in the app. Find LPs that back firms like this one in Hottub’s LP Intelligence: ranked by overlap, with what each holds and how to reach it.
Firms whose LPs overlap
The firms sharing the most LPs on record with Menlo Ventures, relative to how many LPs each has. A peer set like this is what Find LPs ranks LPs from.
- Kickstart Capital, LLC
- Lerer Hippeau
- Goodwater Capital
- Flagship Pioneering
- Battery Ventures
- Trident Capital, Inc.
Find LPs for Menlo Ventures and these firms: Hottub ranks the LPs that hold their funds, the ones still adding funds first.
Track record
A score of 71 out of 100 from 14 of the 22 funds public LPs report, 12 of them in the top half of their vintage. Its ranked funds’ median TVPI is 1.97x and median DPI 0.50x. Pooled where reports give cash flows: 2.00x TVPI, 0.83x DPI. That ranks it 7th of 123 managers with a score.
Each fund once, as the latest of 5 LPs’ reports ranks it by TVPI against funds of the same vintage in those reports; 50 is the median fund, and a short record is pulled toward 50. The full record in LP Intelligence, with each fund’s rank and what usually follows a fund like its latest, or every manager’s.
Reported fund performance
As reported by public LPs that invested in these funds, net of fees. “Versus vintage” ranks each fund against every other fund of the same vintage in that LP’s report, mostly private equity and venture funds. Open a fund for its cash flows and full peer ranking.
| Fund | Vintage | Net IRR | Versus vintage (IRR) | TVPI | DPI | Reported by |
|---|---|---|---|---|---|---|
| Menlo Venture Select I | 2026 | 54.8% | Top quartile | 1.41x | — | New Mexico State Investment Council |
| Menlo Ventures XVII | 2026 | 28.4% | 1.23x | 0.00x | Washington State Investment Board | |
| Menlo Inflection IV | 2025 | 61.8% | Top quartile | 1.36x | — | New Mexico State Investment Council, Washington State Investment Board |
| Menlo Ventures XVII | 2025 | 28.7% | Second quartile | 1.23x | — | New Mexico State Investment Council |
| Menlo Olympic Fund I | 2023 | 37.6% | Top quartile | 1.57x | 0.00x | Washington State Investment Board |
| Menlo Ventures XVI | 2023 | 43.9% | Top quartile | 1.72x | — | New Mexico State Investment Council |
| Menlo Inflection III | 2022 | 45.0% | Top quartile | 2.09x | — | New Mexico State Investment Council, Washington State Investment Board |
| Menlo Ventures XV | 2020 | 16.0% | Top quartile | 1.80x | — | New Mexico State Investment Council, Washington State Investment Board |
| Menlo Inflection II | 2019 | 10.7% | Third quartile | 1.64x | 0.12x | Washington State Investment Board |
| Menlo Ventures XIV | 2017 | 14.7% | Third quartile | 2.12x | 0.41x | Washington State Investment Board |
| Menlo Inflection I | 2016 | 12.3% | Second quartile | 2.48x | 0.21x | Washington State Investment Board |
| Menlo Ventures XII | 2015 | 9.4% | Bottom quartile | 1.88x | 0.61x | Washington State Investment Board |
| Menlo Ventures XI | 2011 | 29.0% | Top quartile | 4.19x | 3.63x | Washington State Investment Board |
| Menlo Ventures X | 2006 | 10.4% | Top quartile | 2.06x | 2.04x | Washington State Investment Board, Alaska Permanent Fund Corporation (APFC) |
| Menlo Ventures IX | 2001 | 0.3% | Bottom quartile | 1.02x | 1.02x | Washington State Investment Board, Los Angeles City Employees' Retirement System (LACERS) |
| Menlo Ventures VIII | 1999 | -8.9% | Bottom quartile | 0.50x | 0.50x | Washington State Investment Board, Los Angeles City Employees' Retirement System (LACERS) |
| Menlo Ventures VII | 1997 | 135.6% | Top quartile | 4.71x | 4.71x | Washington State Investment Board, Los Angeles City Employees' Retirement System (LACERS) |
| Menlo Ventures VI | 1993 | 40.8% | 3.11x | 3.11x | Washington State Investment Board | |
| Menlo Ventures IV | 1988 | 42.1% | 5.13x | 5.13x | Washington State Investment Board | |
| Menlo Ventures III | 1983 | 7.2% | Third quartile | 1.57x | 1.57x | Washington State Investment Board |
| Menlo Venture Partners | 1981 | 6.1% | 1.31x | 1.31x | Washington State Investment Board | |
| Menlo Inflection IV | — | N/M | — | — | State of Michigan Retirement System (SMRS) | |
| Menlo Special Opportunities Fund II | — | N/M | — | — | State of Michigan Retirement System (SMRS) | |
| Menlo Special Opportunities Fund III | — | N/M | — | — | State of Michigan Retirement System (SMRS) | |
| Menlo Ventures IX | — | N/M | — | — | State of Michigan Retirement System (SMRS) | |
| Menlo Ventures X | — | N/M | — | — | State of Michigan Retirement System (SMRS) | |
| Menlo Ventures XI | — | N/M | — | — | State of Michigan Retirement System (SMRS) | |
| Menlo Ventures XIV | — | N/M | — | — | State of Michigan Retirement System (SMRS) | |
| Menlo Ventures XV | — | N/M | — | — | State of Michigan Retirement System (SMRS) | |
| Menlo Ventures XVI | — | N/M | — | — | State of Michigan Retirement System (SMRS) | |
| Menlo Ventures XVII | — | N/M | — | — | State of Michigan Retirement System (SMRS) |
Alaska Permanent Fund Corporation (APFC): APFC Private Equity Report: Private Equity Fund Commitments & Direct Investments / Co-Investments, as of December 31, 2025. APFC's quarterly Private Equity report ("Private Equity Fund Commitments & Direct Investments / Co-Investments") lists each fund with only its currency, "Vintage Year" and "Commitment (USD)", shown here in whole US dollars as printed. It reports no contributions, distributions, market value, multiple or IRR per fund, so paid-in, distributed, total value, IRR, TVPI and DPI are blank; nothing is derived or estimated. All 454 entries of the report's "Fund Investments" list are included ($17,570,561,197 committed); 15 have the vintage year "TBD" (blank here) and 45 are commitments in another currency that APFC states in US dollars. The report's separate "Direct Investments / Co-Investments" list (56 entries, $2,792,151,600: portfolio companies, co-investment vehicles and manager stakes) is not imported. The two lists add up to the report's printed Total Commitments of $20,362,712,795. For the whole portfolio, including liquidated investments, the report prints Cumulative Contributions of $20,951,089,446, Cumulative Distributions of $22,493,801,627 and a Remaining Fair Market Value of $15,555,575,745. APFC is a state-owned corporation that manages the Alaska Permanent Fund, not a pension plan; its separate Private Income report is not imported. View source
Los Angeles City Employees' Retirement System (LACERS): LACERS Private Equity Portfolio Performance Report, as of December 31, 2025. "Net IRR" and "Net TVPI" as printed in the fund-by-fund appendix of the Private Equity Portfolio Performance Report that LACERS posts semiannually (prepared on its private equity consultant's template; the cover gives www.aksia.com). The report defines TVPI as (cumulative distributions + fair market value) / cumulative contributions and labels IRRs of investments held less than two years "n.m."; 27 funds have no IRR (n.m., or "-" in the report) and 14 have no multiple ("-", mostly commitments with nothing contributed yet), all shown as blank. Dollar amounts are whole US dollars as reported (inception-to-date contributions and distributions). Total value = distributions + fair market value, and DPI = distributions / contributions, are computed. All 408 partnerships in the report are included: 305 active and 103 liquidated (no remaining fair market value), of which 23 are in LACERS' Specialized Portfolio and the rest in its Core Portfolio. LACERS counts 36 Credit/Distressed and 15 Natural Resources (energy) partnerships as private equity in this report, alongside buyout, growth equity, venture capital, secondaries, co-investment and fund-of-funds vehicles; its separate private credit and real estate reports are not imported. View source
State of Michigan Retirement System (SMRS): State of Michigan Investment Board Report: SMRS Private Equity, Net Market Value by Entity, as of December 31, 2025. The State of Michigan Investment Board lists each private equity entity with only two amounts, an "Adjusted Reported Value" (shown here as the market value, in whole dollars as printed) and an "Unfunded Commitment" (not shown). It reports no commitment amount, contributions, distributions, vintage year, multiple or IRR per fund, so committed, paid-in, distributed, total value, IRR, TVPI and DPI are blank; nothing is derived or estimated. The report does not define how the reported value is adjusted. Every entity in the Private Equity table is included as classified by the Board (buyout, growth, venture, secondaries, co-investment and separate-account vehicles); the Real Estate and Infrastructure, Real Return and Opportunistic, and Absolute Return tables are not imported. The entities add up to the Board's printed Total of $24,750,150,762 reported value and $7,378,170,291 unfunded; its "Short Term Investments and Other" and "Income Accruals" lines are not funds and are left out. 4 entities are marked by the Board as new commitments made during the quarter. View source
New Mexico State Investment Council: New Mexico State Investment Council Private Equity Performance Updates: Fund Summaries (Active Funds), as of March 31, 2026. Net IRR and net multiple since inception as printed in the fund summaries of the quarterly performance updates that Mercer prepares for the Council (data source given as Invient), published in the Council's public meeting materials. The fund summaries head the two columns "Net" (Multiple, IRR); their total rows equal the "Net Multiple" and "Net IRR" of active commitments in the reports' dashboards. The net multiple is used as TVPI. The fund summaries give only committed capital, exposure (NAV + unfunded), net multiple and IRR for each fund, so contributions, distributions, total value and DPI are blank; contributions and distributions are reported by program and strategy only. Committed capital is reported in $ millions to one decimal and converted to whole dollars. Vintage year is defined by the reports as the year of the fund's first cash flow. 27 of the newest funds are marked N/A or NM (not defined in the reports) and lack an IRR, a multiple or both. The IRR of The Veritas Capital Fund IX, L.P. is printed as "#######" (not readable) and is blank. Frazier Healthcare Growth Buyout Fund XI, L.P. is printed with a negative multiple, imported as printed. Two reports are combined: the National Private Equity Program (175 active funds, $11,121.7 million committed; 32 Venture Capital, 93 Buyout, 33 Growth, 17 Special Situations) and the Strategic Venture Capital Program and New Mexico Private Equity Investment Program (Legacy) (83 active funds, $2,346.3 million committed; 76 Fund Investments, 5 Co-Investment Funds, 1 Catalyst Fund, 1 Recovery Fund). The second report covers the Council's New Mexico-focused venture and private equity commitments, including its own co-investment, catalyst and recovery vehicles. Active funds only: liquidated and sold funds are reported in aggregate, not by fund. The Private Debt, Real Estate and Real Assets reports in the same materials are not imported. View source
Washington State Investment Board: WSIB Private Equity Portfolio Performance Summary By Strategy, as of March 31, 2026. Net IRR as labeled by WSIB, calculated by Hamilton Lane from general partner cash flows and valuations and not confirmed by the general partners. TVPI is WSIB's total value multiple (B+C)/A recomputed to two decimals from the reported totals (WSIB prints one decimal). WSIB lists an initial investment date rather than a vintage year; its year is used as the vintage (blank for commitments not yet funded). Includes realized and legacy partnerships. View source
About this data
Fund sizes come from firm announcements, SEC filings, and press reports, converted to US dollars near the closing date. Compiled as of October 9, 2026. Notable portfolio companies are examples from public sources, not a complete list.
Share this page
For a post, a deck, or a note to your partners: image (PNG) · vector (SVG).