North Carolina Retirement Systems (NCRS)
Public pension plan No recent venture fund
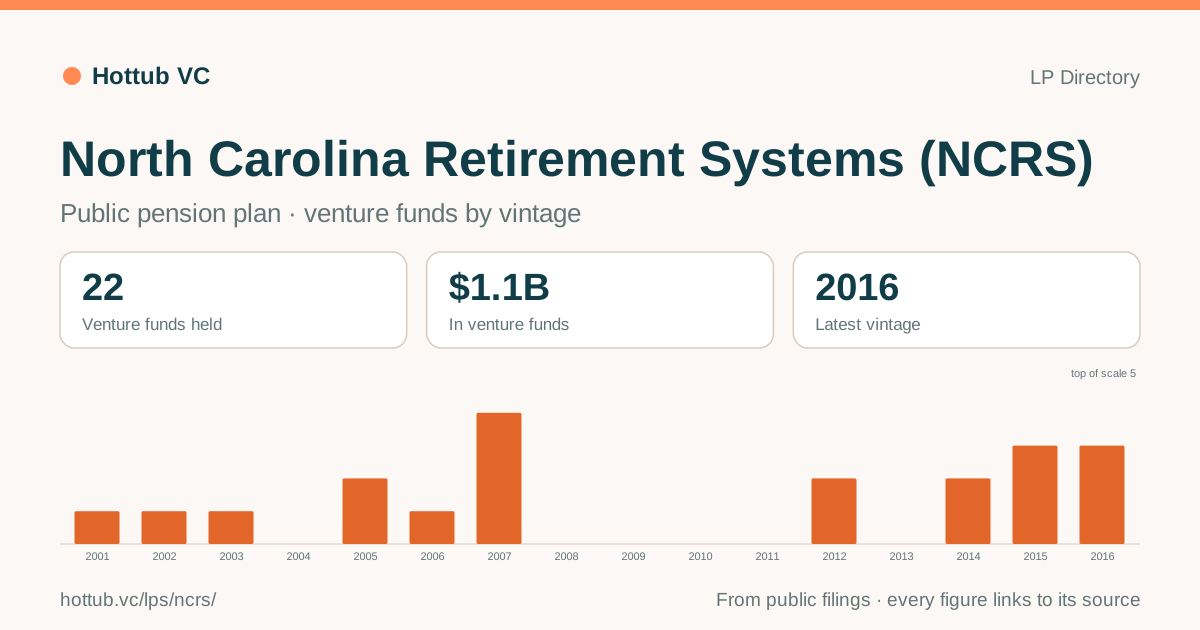
North Carolina Retirement Systems (NCRS) reports 22 venture funds, $1.1B in all.
Holdings are from its report as of December 31, 2025.
The numbers
| Vintage | Venture funds |
|---|---|
| 2001 | 1 |
| 2002 | 1 |
| 2003 | 1 |
| 2004 | 0 |
| 2005 | 2 |
| 2006 | 1 |
| 2007 | 4 |
| 2008 | 0 |
| 2009 | 0 |
| 2010 | 0 |
| 2011 | 0 |
| 2012 | 2 |
| 2013 | 0 |
| 2014 | 2 |
| 2015 | 3 |
| 2016 | 3 |
Updates from North Carolina Retirement Systems (NCRS)
All of North Carolina Retirement Systems (NCRS)’s updates on Hottub VC
Largest venture holdings
From its report as of December 31, 2025.
| Fund, as reported | Manager | Vintage | Commitment |
|---|---|---|---|
| TCV IX, L.P. | TCV | 2016 | $150M |
| TCV VIII, L.P. | TCV | 2014 | $150M |
| Tenaya Capital Fund VII, L.P. | Tenaya Capital | 2015 | $90M |
| ARCH Venture Fund VIII, L.P. | ARCH Venture Partners | 2014 | $80M |
| Tenaya Capital Fund V | Tenaya Capital | 2007 | $75M |
In the app: 17 more venture funds, 14 funds of funds. Open North Carolina Retirement Systems (NCRS) in LP Intelligence for every fund it holds and how to reach it, or find the LPs that back firms like yours.
How it invests
Steady: it backs its managers again about as often as most LPs that report fund by fund. It backed 71% of its managers again when they raised a later fund (49 chances), and stays with a manager 6.5 years on average.
From its own report and published commitments. How it invests in LP Intelligence: whether it kept committing through 2022–23, how much goes to managers on Fund I–III, and what it committed to lately.
Recent commitments
| Date | Fund, as published | Manager | Commitment | Source |
|---|---|---|---|---|
| August 2026 | Andreessen Horowitz: A16Z SMA | Andreessen Horowitz | $1B | Document |
| August 2026 | Lightspeed AI REND Fund I LP | — | $125M | Document |
| June 2026 | Pinegrove Capital Partners: CN Strategic Venture Tranche A & B | Pinegrove Venture Partners, LLC | $520M | Document |
| June 2026 | PSG Europe III SCSp | — | — | Document |
| June 2026 | Arctos Keystone Partners Fund & SMA | — | $400M | Document |
| May 2026 | Providence Equity Partners (Constellation) LP | — | $300M | Document |
| May 2026 | Y Combinator: YCP26 | Y Combinator | $237M | Document |
| May 2026 | Y Combinator: YCA26 | Y Combinator | $101M | Document |
| May 2026 | Y Combinator ES26 | Y Combinator | $32M | Document |
| May 2026 | Ares IV OOSA | — | $1.5B | Document |
| February 2026 | Bridgepoint Europe VIII LP | — | — | Document |
| February 2026 | Bridgepoint Europe SMA | — | — | Document |
The latest 12 of 15 commitments from the last 24 months to private equity and venture funds, as North Carolina Retirement Systems (NCRS) published them. Dates are the month only: the plan gives no day. Amounts are commitments as the plan reports them. What this plan publishes · every plan’s recent commitments.
LPs nearby
Within 100 miles, by city: a trip to one can take in the others.
- The Asha and Sajjan Agarwal Foundation
- Szulik Family Foundation
- Sall Family Foundation
- The RJM Foundation
- Laughing Gull Foundation
- Viridi Futuro Foundation
- The John G B Jr and Jane R Ellison Family Foundation Inc
- The Bodford Family Foundation
12 LPs within 100 miles in all: see them on the map.
About this data
Holdings as this LP reports them, fund by fund. Amounts are its commitment to each fund. Fund performance it reports is on each firm’s page. As of December 31, 2025. Source: NCRS Market Value and Performance Report: NCRS Private Equity Portfolio. Funds are linked to a manager by name; a match can be wrong, and the original filing is the record. How Hottub reads its sources.
"IRR", "TVPI" and "DPI" as printed in the "NCRS Private Equity Portfolio" table of the calendar-year NCRS Market Value and Performance Report posted by the North Carolina Department of State Treasurer. The report's notes say returns are calculated using the internal rate of return methodology and "are reported net of fees", that TVPI is the ratio of cumulative distributions plus the valuation to cumulative paid-in, and that DPI is the ratio of cumulative distributions to cumulative paid-in. Dollar values are reported in thousands and shown here multiplied by 1,000. The table gives each fund's vintage, market value, commitment, unfunded commitment and distributions, but not contributions, so paid-in capital is blank; total value = distributions + market value is computed. A dash or "N/A" in the IRR or TVPI column is shown as blank (11 funds have no IRR, mostly commitments with little or nothing paid in). All 174 funds in the table are included (buyout, growth, venture, secondaries, co-investment and fund-of-funds vehicles as the Treasurer classifies them), of which 74 carry a liquidation year and no market value; the table's "Stock Distribution" and cash lines ($515,000 of market value) are not funds and are left out. The funds add up to the report's "Total Private Equity Portfolio" row: $6,802,884,000 market value, $16,595,939,000 commitments, $3,799,415,000 unfunded and $15,429,993,000 distributions. The Non-Core Real Estate, Opportunistic Fixed Income, Inflation Sensitive, Core Real Estate and Multi-Strategy tables in the same report are not imported.
Share this page
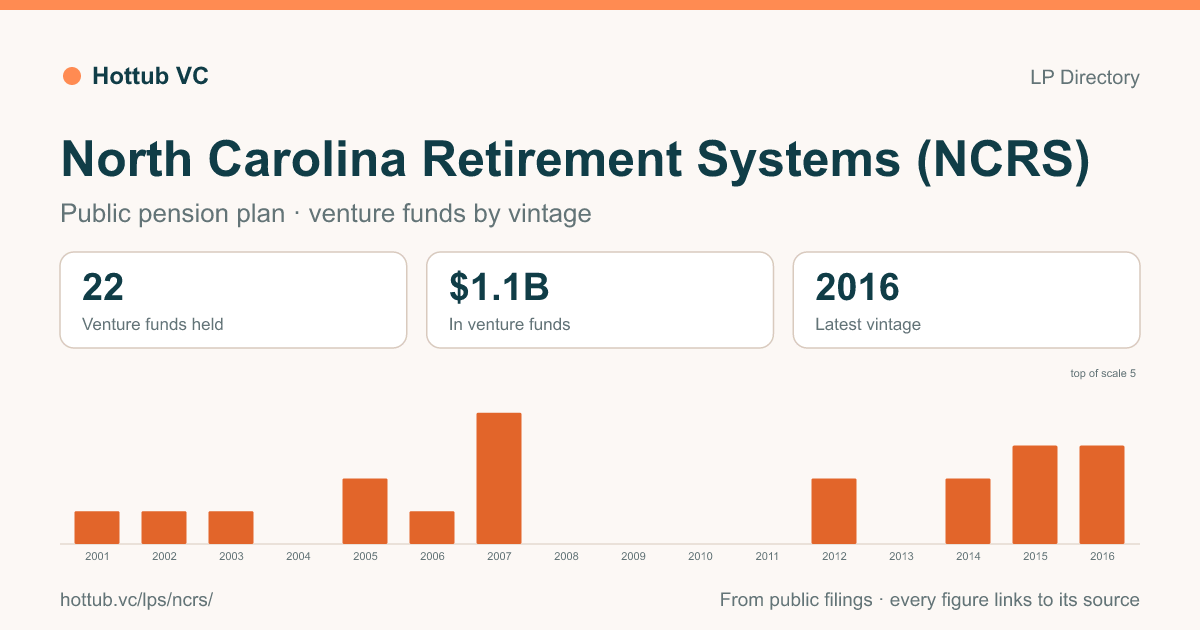
For a post, a deck, or a note to your partners: image (PNG) · vector (SVG).