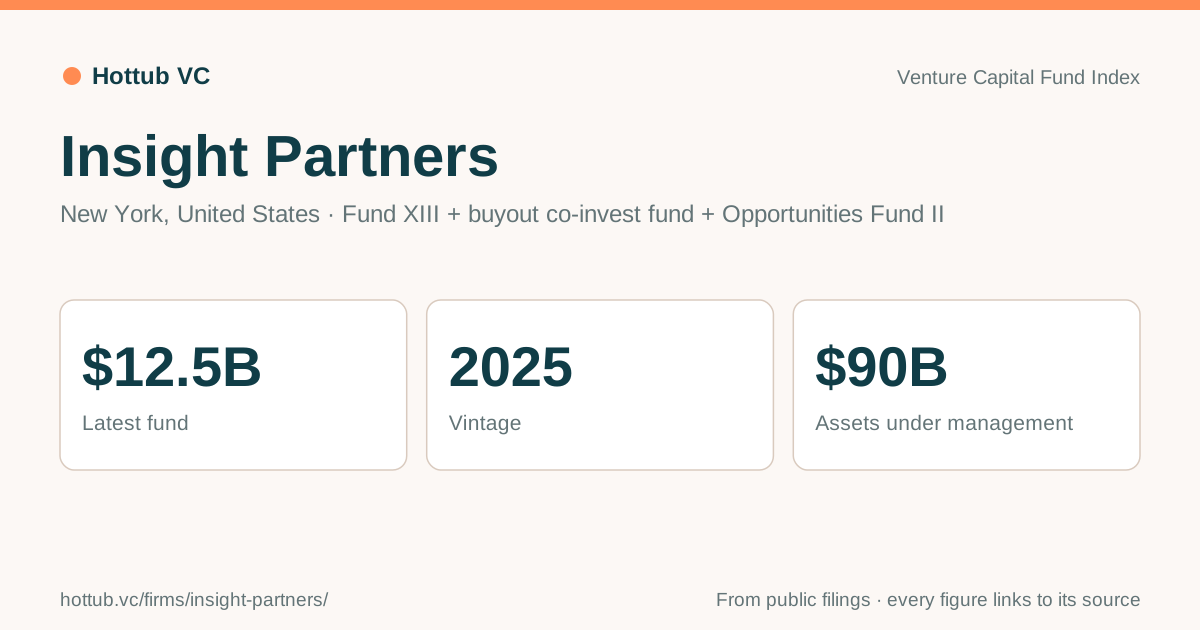
Insight Partners
Also known as Insight Venture Partners
New York, United States Founded 1995 insightpartners.com New York ecosystem (#2 of 32)
Insight Partners’s latest fund is Fund XIII + buyout co-invest fund + Opportunities Fund II: $12.5B, 2025, #3 of 427 firms by latest fund.
Updates from Insight Partners
Overview
Closed January 2025, well below the reported $20B Fund XIII target. AUM is regulatory AUM ('over $90B').
Funds
| Fund | Closed | Size | Source |
|---|---|---|---|
| Fund XIII + buyout co-invest fund + Opportunities Fund II | 2025 | $12.5B | insightpartners.com |
LPs on the record
14 private foundations list on their latest IRS Form 990-PF, and 49 other LPs report holding Insight Partners’s funds.
60 more LPs are in the app. Find LPs that back firms like this one in Hottub’s LP Intelligence: ranked by overlap, with what each holds and how to reach it.
Firms whose LPs overlap
The firms sharing the most LPs on record with Insight Partners, relative to how many LPs each has. A peer set like this is what Find LPs ranks LPs from.
- Lightspeed Venture Partners
- August Equity LLP
- New Enterprise Associates
- TCV
- Flagship Pioneering
- Canaan Partners
Find LPs for Insight Partners and these firms: Hottub ranks the LPs that hold their funds, the ones still adding funds first.
Track record
A score of 67 out of 100 from 9 of the 23 funds public LPs report, 6 of them in the top half of their vintage. Its ranked funds’ median TVPI is 1.75x and median DPI 0.18x. Pooled where reports give cash flows: 2.64x TVPI, 1.36x DPI. That ranks it 15th of 123 managers with a score.
Each fund once, as the latest of 24 LPs’ reports ranks it by TVPI against funds of the same vintage in those reports; 50 is the median fund, and a short record is pulled toward 50. The full record in LP Intelligence, with each fund’s rank and what usually follows a fund like its latest, or every manager’s.
Reported fund performance
As reported by public LPs that invested in these funds, net of fees. “Versus vintage” ranks each fund against every other fund of the same vintage in that LP’s report, mostly private equity and venture funds. Open a fund for its cash flows and full peer ranking.
| Fund | Vintage | Net IRR | Versus vintage (IRR) | TVPI | DPI | Reported by |
|---|---|---|---|---|---|---|
| Insight Partners XIII | 2025 | 21.8% | Second quartile | — | — | Colorado Public Employees' Retirement Association (Colorado PERA) |
| Insight Partners Fund XIII | 2024 | N/M | 1.17x | 0.00x | NYC Fire Pension Fund, NYC Employees' Retirement System (NYCERS) | |
| Insight Partners XIII | 2024 | N/M | 1.17x | 0.00x | NYC Police Pension Fund, LACERA, Orange County Employees Retirement System (OCERS), CalPERS, NYC Teachers' Retirement System | |
| Insight Partners XIII Growth Buyout Fund | 2024 | N/M | — | 0.00x | CalPERS | |
| Insight Partners Fund XI Follow-On Fund | 2022 | 6.5% | Second quartile | 1.18x | 0.00x | Texas Municipal Retirement System |
| Insight Partners Fund XII | 2021 | 3.4% | Bottom quartile | 1.11x | 0.00x | Pennsylvania SERS |
| Insight Partners XII | 2021 | 2.6% | Bottom quartile | 1.10x | 0.00x | Texas Municipal Retirement System, NYC Fire Pension Fund, NYC Police Pension Fund, Washington State Investment Board, Colorado Public Employees' Retirement Association (Colorado PERA), NYC Employees' Retirement System (NYCERS), Orange County Employees Retirement System (OCERS), Alaska Permanent Fund Corporation (APFC), CalPERS, NYC Teachers' Retirement System, Pennsylvania PSERS, NYC Board of Education Retirement System (BERS) |
| Insight Partners XII Buyout Annex Fund | 2021 | 6.0% | Third quartile | 1.23x | 0.00x | Texas Municipal Retirement System, NYC Fire Pension Fund, NYC Police Pension Fund, NYC Employees' Retirement System (NYCERS), CalPERS, NYC Teachers' Retirement System, Pennsylvania PSERS, NYC Board of Education Retirement System (BERS) |
| Insight Partners XI | 2020 | 11.2% | Third quartile | 1.73x | 0.11x | Texas Municipal Retirement System, Washington State Investment Board, Colorado Public Employees' Retirement Association (Colorado PERA), Alaska Permanent Fund Corporation (APFC), CalPERS |
| Insight Venture Partners XI | 2020 | 12.3% | Second quartile | 1.75x | 0.18x | Pennsylvania SERS |
| Insight Partners XI | 2019 | 12.6% | Top quartile | 1.80x | — | Orange County Employees Retirement System (OCERS), Pennsylvania PSERS |
| Insight Venture Partners X | 2018 | 21.3% | Top quartile | — | 1.21x | Colorado Public Employees' Retirement Association (Colorado PERA), Pennsylvania SERS, CalPERS |
| Insight Venture Partners X | 2017 | N/M | — | — | Greater Manchester Pension Fund (GMPF), Alaska Permanent Fund Corporation (APFC), Pennsylvania PSERS | |
| Insight Venture Partners Growth-Buyout Coinvestment Fund (B) | 2015 | 25.5% | Top quartile | 3.50x | 2.82x | CalPERS |
| Insight Venture Partners Growth-Buyout Coinvestment Fund | 2015 | 24.4% | Top quartile | 3.24x | 2.76x | Washington State Investment Board |
| Insight Venture Partners IX | 2015 | 22.5% | Top quartile | 3.95x | 2.77x | Washington State Investment Board, Colorado Public Employees' Retirement Association (Colorado PERA), Greater Manchester Pension Fund (GMPF), Los Angeles City Employees' Retirement System (LACERS), Pennsylvania SERS, CalPERS |
| Insight Venture Partners Coinvestment Fund III | 2014 | N/M | — | — | Alaska Permanent Fund Corporation (APFC) | |
| Insight Venture Partners IX | 2014 | N/M | — | — | Alaska Permanent Fund Corporation (APFC) | |
| Insight Venture Partners VIII | 2013 | 20.0% | Top quartile | 3.14x | 2.37x | Washington State Investment Board, Los Angeles City Employees' Retirement System (LACERS), Pennsylvania SERS, Alaska Permanent Fund Corporation (APFC) |
| Insight Venture Partners VII | 2011 | 20.7% | 3.08x | 2.48x | Pennsylvania SERS, Alaska Permanent Fund Corporation (APFC) | |
| Insight Venture Partners Coinvestment Fund II | 2010 | N/M | — | — | Alaska Permanent Fund Corporation (APFC) | |
| Insight Partners XI | — | N/M | 1.72x | 0.10x | New York State Common Retirement Fund, State of Michigan Retirement System (SMRS), UTIMCO (Permanent University Fund) | |
| Insight Partners XII Buyout Annex Fund | — | N/M | 1.22x | 0.00x | New York State Common Retirement Fund, UTIMCO (Permanent University Fund), Public School and Education Employee Retirement Systems of Missouri (PSRS/PEERS) | |
| Insight Partners XII | — | N/M | 1.09x | 0.00x | New York State Common Retirement Fund, State of Wisconsin Investment Board (SWIB), State of Michigan Retirement System (SMRS), UTIMCO (Permanent University Fund), Teachers' Retirement System of the State of Illinois (TRS) | |
| Insight Partners | — | N/M | — | — | Connecticut Retirement Plans and Trust Funds (CRPTF) | |
| Insight Partners (Cayman) XI | — | N/M | — | — | Ireland Strategic Investment Fund | |
| Insight Partners (Eu) XIII S.C | — | N/M | — | — | Ireland Strategic Investment Fund | |
| Insight Partners Fund X Follow-On Fund | — | N/M | — | — | State of Michigan Retirement System (SMRS) | |
| Insight Partners Fund XIII | — | N/M | — | — | Teachers' Retirement System of the State of Illinois (TRS) | |
| Insight Partners IX, X, XI, XII, XIII, XIII GBO | — | N/M | — | — | Public School and Education Employee Retirement Systems of Missouri (PSRS/PEERS) | |
| Insight Partners Opportunities Fund I | — | N/M | — | — | Teachers' Retirement System of the State of Illinois (TRS) | |
| Insight Partners Opportunities Fund II | — | N/M | — | — | Connecticut Retirement Plans and Trust Funds (CRPTF), Teachers' Retirement System of the State of Illinois (TRS) | |
| Insight Partners Opportunities I Annex A | — | N/M | — | — | Teachers' Retirement System of the State of Illinois (TRS) | |
| Insight Partners XII Annex A | — | N/M | — | — | Teachers' Retirement System of the State of Illinois (TRS) | |
| Insight Partners XIII | — | N/M | 1.17x | 0.00x | New York State Common Retirement Fund, State of Michigan Retirement System (SMRS) | |
| Insight Venture Partners (Cayman) X | — | N/M | — | — | Ireland Strategic Investment Fund | |
| Insight Venture Partners GBCF | — | N/M | — | — | State of Michigan Retirement System (SMRS) | |
| Insight Venture Partners IX | — | N/M | — | — | State of Michigan Retirement System (SMRS) | |
| Insight Venture Partners X Follow-On Fund | — | N/M | 0.90x | 0.07x | New York State Common Retirement Fund | |
| Insight Venture Partners X | — | N/M | 2.78x | 1.14x | New York State Common Retirement Fund, State of Michigan Retirement System (SMRS) |
Alaska Permanent Fund Corporation (APFC): APFC Private Equity Report: Private Equity Fund Commitments & Direct Investments / Co-Investments, as of December 31, 2025. APFC's quarterly Private Equity report ("Private Equity Fund Commitments & Direct Investments / Co-Investments") lists each fund with only its currency, "Vintage Year" and "Commitment (USD)", shown here in whole US dollars as printed. It reports no contributions, distributions, market value, multiple or IRR per fund, so paid-in, distributed, total value, IRR, TVPI and DPI are blank; nothing is derived or estimated. All 454 entries of the report's "Fund Investments" list are included ($17,570,561,197 committed); 15 have the vintage year "TBD" (blank here) and 45 are commitments in another currency that APFC states in US dollars. The report's separate "Direct Investments / Co-Investments" list (56 entries, $2,792,151,600: portfolio companies, co-investment vehicles and manager stakes) is not imported. The two lists add up to the report's printed Total Commitments of $20,362,712,795. For the whole portfolio, including liquidated investments, the report prints Cumulative Contributions of $20,951,089,446, Cumulative Distributions of $22,493,801,627 and a Remaining Fair Market Value of $15,555,575,745. APFC is a state-owned corporation that manages the Alaska Permanent Fund, not a pension plan; its separate Private Income report is not imported. View source
CalPERS: CalPERS Private Equity Program Fund Performance, as of December 31, 2025. Net IRR and investment multiple as reported by CalPERS. N/M (not meaningful) for funds in early years is shown as blank. View source
Connecticut Retirement Plans and Trust Funds (CRPTF): Connecticut Annual Report of the Treasurer: Combined Investment Funds, List of Investment Advisors and Net Assets Under Management (Private Equity Fund), as of June 30, 2025. The Treasurer's annual list gives each partnership in the Private Equity Fund with only its investment strategy and "Net Assets Under Management" at fiscal year-end (shown here as the market value, in whole dollars as printed). It reports no commitment amount, contributions, distributions, vintage year, multiple or IRR per partnership, so committed, paid-in, distributed, total value, IRR, TVPI and DPI are blank; nothing is derived or estimated. Partnership names are printed in a shortened form and are shown as printed. Private Equity Fund section only, as classified by the Treasurer (63 Buyout, 7 Growth Equity, 9 Venture Capital, 13 Secondaries, 5 Mezzanine, 2 Distressed/Restructuring; it includes co-investment and secondaries vehicles); the Private Credit, Real Estate, Infrastructure and Natural Resources, and Absolute Return funds are not imported. The partnerships listed hold $7,503,852,493 of the Private Equity Fund's $7,558,426,842 net assets; the rest is the Treasurer's "Other" line ($54,574,348: partnerships with nonmaterial balances, cash equivalents and other net assets), which is not listed by name and is left out. View source
Colorado Public Employees' Retirement Association (Colorado PERA): Colorado PERA Private Equity Holdings, as of December 31, 2025. The IRR is the column PERA heads "Colorado PERA's Since Inception IRR"; PERA does not label it net or gross. PERA states that the limited partnership recordkeeping, including the IRR, is maintained internally by PERA for each limited partnership, that its IRR calculation method may differ from the methods used by the general partners or other limited partners, and that none of the information has been reviewed or approved by the general partners. 5 partnerships are marked "NM" (not meaningful) and have no IRR. PERA lists each partnership's vintage year, capital committed ("original primary commitments"), capital contributed and capital distributed in whole dollars, and no fair value or multiple, so total value and TVPI are blank (PERA says disclosure for this asset class is limited to this information, as required by Colorado Revised Statute § 24-51-213(3)); DPI = capital distributed / capital contributed is computed, and is blank for the 5 partnerships whose capital distributed is printed as a negative amount. 41 partnerships carry PERA's footnote "Assets transferred subsequent to 2010 merger of Denver Public Schools Retirement System" and are listed under vintage year 2010, the year of the merger; their vintage is left blank. All 425 rows of PERA's Private Equity list are included, liquidated partnerships among them, as PERA classifies them (buyout, growth, venture, secondaries, co-investments and some credit, mezzanine and energy partnerships); its separate Alternatives, Hedge Funds and Real Estate lists are not imported. View source
Greater Manchester Pension Fund (GMPF): GMPF Private Markets Investment Data: Private Equity and Venture Capital funds, as of December 31, 2025. GMPF lists its private equity and venture capital funds each quarter, each with the fund's currency, a commitment (net of cancelled amounts), cumulative drawdowns, cumulative distributions and a valuation, all in millions to two decimals, and a vintage year; it reports no multiple or IRR and prints no total. Shown here: commitment as committed, drawdowns as paid-in, distributions as distributed, the valuation as market value, and total value as distributions plus valuation (derived). TVPI and DPI are left blank because GMPF says performance metrics calculated from the data should not be used to compare returns among funds. Dollar amounts are converted: the amounts are read as millions of each fund's own currency (56 funds in US dollars, 53 in euro, 70 in pounds); the latest list prints a pound sign on every amount, including those of dollar and euro funds, while earlier lists in the same file print the same figures with no symbol, and GMPF does not say which is meant. Euro amounts are multiplied by 1.1736 and pound amounts by 1.3447 US dollars, the Federal Reserve's H.10 foreign exchange rates for 2025-12-31 (federalreserve.gov/releases/h10/hist/dat00_eu.htm and dat00_uk.htm), and rounded to the dollar; dollar amounts are as printed. Drawdowns and distributions made over many years are therefore converted at the 2025-12-31 rate, not the rates when the cash moved. The list goes back to funds of vintage 1981: 105 of the 179 funds have a valuation of zero. GMPF's own notes: valuations are provided by each fund's general partner or manager, have not necessarily been audited, may be older than the list's date with adjustments for later cash flows, and may not reflect realisable value. Since July 2018 GMPF has invested in private equity through the Northern LGPS joint venture, Northern Private Equity Pool LP, whose holdings are not in this list. View source
Teachers' Retirement System of the State of Illinois (TRS): TRS Annual Comprehensive Financial Report, fiscal year 2025: Investment Assets Under Management, Private Equity, as of June 30, 2025. TRS lists each private equity partnership with one amount, its "Assets" at the fiscal year end, in the schedule "Investment Assets Under Management" of its Annual Comprehensive Financial Report (shown here as the market value, in whole dollars as printed). It reports no commitment amount, contributions, distributions, vintage year, multiple or IRR per fund, so committed, paid-in, distributed, total value, IRR, TVPI and DPI are blank; nothing is derived or estimated. All 263 entries under the schedule's "Private Equity" heading are included as TRS classifies them (buyout, growth, venture, co-investment and separately managed vehicles; 53 are "Annex" entries that TRS lists separately beside a fund of the same manager); the Public Equity, Real Assets, Income and Diversifying Strategies groups are not imported. The entries add up to $12,776,014,572, which equals the fair value of private equity partnerships in the notes to the report's financial statements ($12,776,014,570). The schedule's own note says it does not include managers terminated before June 30, 2025 with residual assets in the account. View source
Ireland Strategic Investment Fund: NTMA Annual Report 2025: ISIF Discretionary Investments, Unquoted Investment Funds, as of December 31, 2025. The National Treasury Management Agency lists every unquoted investment fund the Ireland Strategic Investment Fund holds at the year end with two amounts in millions of euro, a "Commitment" and a "Value" (shown here as the market value); it reports no vintage year, contributions, distributions, multiple or IRR per fund, so those are blank. Dollar amounts are converted: every amount here is the printed euro amount multiplied by 1.1736 US dollars per euro, the Federal Reserve's H.10 foreign exchange rate for 2025-12-31 (federalreserve.gov/releases/h10/hist/dat00_eu.htm), and rounded to the dollar; a commitment made in another currency is printed by the Agency in euro, so it will not convert back to exactly its original amount. The Agency does not say what kind of fund each line is. Of the 162 lines in the list (total value €3,103.88 million), 28 whose own name says property, housing, hotel or logistics, infrastructure or wind and renewable power, debt, credit or mezzanine lending, or forestry are left out, as are 3 lines whose value is withheld as commercially sensitive; the other 131 are included as funds, and some of them invest in energy, housing, land or lending rather than private equity or venture capital. The separate list of unitised funds (hedge and listed-equity funds), the direct private equity holdings, loans and quoted securities in the same report are not imported. View source
LACERA: LACERA Private Markets Holding Report (Private Equity), as of March 31, 2026. "ITD IRR" (inception to date) and "Investment Multiple" as printed by LACERA, which does not label the IRR net or gross and does not say in the report how or by whom it is calculated or when it is not meaningful, so IRRs of very young funds are shown as printed. The Investment Multiple equals (distributions + market value) / contributions and is used as TVPI; total value = distributions + market value and DPI = distributions / contributions are computed. Dollar amounts are rounded to whole dollars. Only holdings LACERA classes as Private Equity are included (not its real estate, hedge fund, illiquid credit or real assets holdings). 9 commitments with nothing contributed yet have no market value, multiple or IRR, and 3 new commitments are listed without any amounts. View source
Los Angeles City Employees' Retirement System (LACERS): LACERS Private Equity Portfolio Performance Report, as of December 31, 2025. "Net IRR" and "Net TVPI" as printed in the fund-by-fund appendix of the Private Equity Portfolio Performance Report that LACERS posts semiannually (prepared on its private equity consultant's template; the cover gives www.aksia.com). The report defines TVPI as (cumulative distributions + fair market value) / cumulative contributions and labels IRRs of investments held less than two years "n.m."; 27 funds have no IRR (n.m., or "-" in the report) and 14 have no multiple ("-", mostly commitments with nothing contributed yet), all shown as blank. Dollar amounts are whole US dollars as reported (inception-to-date contributions and distributions). Total value = distributions + fair market value, and DPI = distributions / contributions, are computed. All 408 partnerships in the report are included: 305 active and 103 liquidated (no remaining fair market value), of which 23 are in LACERS' Specialized Portfolio and the rest in its Core Portfolio. LACERS counts 36 Credit/Distressed and 15 Natural Resources (energy) partnerships as private equity in this report, alongside buyout, growth equity, venture capital, secondaries, co-investment and fund-of-funds vehicles; its separate private credit and real estate reports are not imported. View source
State of Michigan Retirement System (SMRS): State of Michigan Investment Board Report: SMRS Private Equity, Net Market Value by Entity, as of December 31, 2025. The State of Michigan Investment Board lists each private equity entity with only two amounts, an "Adjusted Reported Value" (shown here as the market value, in whole dollars as printed) and an "Unfunded Commitment" (not shown). It reports no commitment amount, contributions, distributions, vintage year, multiple or IRR per fund, so committed, paid-in, distributed, total value, IRR, TVPI and DPI are blank; nothing is derived or estimated. The report does not define how the reported value is adjusted. Every entity in the Private Equity table is included as classified by the Board (buyout, growth, venture, secondaries, co-investment and separate-account vehicles); the Real Estate and Infrastructure, Real Return and Opportunistic, and Absolute Return tables are not imported. The entities add up to the Board's printed Total of $24,750,150,762 reported value and $7,378,170,291 unfunded; its "Short Term Investments and Other" and "Income Accruals" lines are not funds and are left out. 4 entities are marked by the Board as new commitments made during the quarter. View source
NYC Board of Education Retirement System (BERS): New York City Board of Education Retirement System Performance Overview: Alternative Assets Manager Performance Detail, Private Equity, as of September 30, 2024. From the "Alternative Assets Manager Performance Detail" appendix of the quarterly Performance Overview in the system's investment meeting package, published by the New York City Comptroller's Bureau of Asset Management; the table says its information is provided by the system's consultants and runs one quarter behind the overview. This is the newest package in the library with a private equity table: 3 newer quarterly packages are without one. The return column is labeled "ITD IRR%" (inception to date), not net or gross; the table's total row gives 13.1%. TVPI is the printed "Investment Multiple" (it equals (distributions + market value) / contributions); total value = distributions + market value and DPI = distributions / contributions are computed. Vintage is the report's "Vintage Year (Cash Flow)". IRR is blank where the report prints n.m. (1 investment) or leaves the cell empty (5 commitments with nothing contributed, for which the report prints a multiple of 0.00, left blank here); 3 rows carry a negative market value as printed. All 133 rows of the private equity table, which it heads "TOTAL ACTIVE", are included: funds, co-investment vehicles and emerging manager program vehicles, each program being one row without the funds it holds (the table gives no strategy per row). Their commitments, contributions and distributions add up to the printed TOTAL PRIVATE EQUITY ($1,945,546,444 committed); their market values add up to $1,212,029,767, $575,330 more than the printed total of $1,211,454,437, a difference in the report itself (each row's market value agrees with its printed multiple). The appendix's real estate, infrastructure and opportunistic fixed income tables are not imported. View source
NYC Employees' Retirement System (NYCERS): New York City Employees' Retirement System Private Equity Quarterly Report (Public): Private Equity Portfolio, as of December 31, 2025. From the Private Equity Quarterly Report (Public) in the system's quarterly investment meeting package, prepared by its private equity consultant and published by the New York City Comptroller's Bureau of Asset Management. The schedule's column is labeled "IRR", not net or gross; the report calls the portfolio figure in that column (10.5%) a "since inception net IRR", says performance information is "net of fees and expenses charged by the underlying investment, but gross of StepStone vehicle/account fees and expenses", and says the IRRs are calculated by the consultant from information provided by the general partners. TVPI is the printed "Multiple" (it equals (distributed capital + market value) / contributed capital); total value = distributed capital + market value and DPI = distributed capital / contributed capital are computed. Contributed is the report's "Contributed Capital" and vintage its "Vintage Year". IRR is blank where the report prints NM (44 funded investments; the report says performance of funds with less than two years of activity is not considered meaningful) or N/A (1 funded row: CVC Capital Partners IX (A)); 19 commitments have nothing contributed yet, and 5 rows carry a negative market value as printed. All 183 rows of the schedule, which it heads "Active Investments", are included: funds, co-investment vehicles and emerging manager program vehicles, each program being one row without the funds it holds (the schedule gives no strategy per row; the report's summary counts 207 active investments). Their market values add up to the printed Total Portfolio market value ($9,417,505,914); exited investments are not listed, and the Total Portfolio's $22,291,644,425 committed includes them, against $15,631,237,310 for the rows shown. The 2 commitments the report lists as closed after the as-of date are not included. Real estate, infrastructure and credit are reported separately and are not imported. View source
NYC Fire Pension Fund: New York City Fire Pension Fund Private Equity Quarterly Report (Public): Private Equity Portfolio, as of March 31, 2026. From the Private Equity Quarterly Report (Public) in the fund's quarterly investment meeting package, prepared by its private equity consultant and published by the New York City Comptroller's Bureau of Asset Management. The schedule's column is labeled "IRR", not net or gross; the report calls the portfolio figure in that column (11.4%) a "since inception net IRR", says performance information is "net of fees and expenses charged by the underlying investment, but gross of StepStone vehicle/account fees and expenses", and says the IRRs are calculated by the consultant from information provided by the general partners. TVPI is the printed "Multiple" (it equals (distributed capital + market value) / contributed capital); total value = distributed capital + market value and DPI = distributed capital / contributed capital are computed. Contributed is the report's "Contributed Capital" and vintage its "Vintage Year". IRR is blank where the report prints NM (40 funded investments; the report says performance of funds with less than two years of activity is not considered meaningful) or N/A (no funded rows); 15 commitments have nothing contributed yet, and 4 rows carry a negative market value as printed. All 177 rows of the schedule, which it heads "Active Investments", are included: funds, co-investment vehicles and emerging manager program vehicles, each program being one row without the funds it holds (the schedule gives no strategy per row; the report's summary counts 203 active investments). Their market values add up to the printed Total Portfolio market value ($2,083,528,706); exited investments are not listed, and the Total Portfolio's $5,045,236,597 committed includes them, against $3,877,199,933 for the rows shown. The 3 commitments the report lists as closed after the as-of date are not included. Real estate, infrastructure and credit are reported separately and are not imported. View source
NYC Police Pension Fund: New York City Police Pension Fund Private Equity Quarterly Report (Public): fund schedule, as of March 31, 2026. From the Private Equity Quarterly Report (Public) in the fund's quarterly investment meeting package, a portfolio report that carries Aksia's legend, published by the New York City Comptroller's Bureau of Asset Management. The report is dated "As Of Mar-2026", taken here as that month's last day. The schedule's return column is headed "Current Quarter IRR"; the footnote to its PME Spread column calls it "the Net IRR", and the portfolio figure in that column is 11.0%. TVPI is the printed "Multiple" (it equals (total distributions + market value) / total contributions); total value = total distributions + market value and DPI = total distributions / total contributions are computed. Contributed is the report's "Total Contributions" and vintage its "Vintage". IRR is blank where the report prints n.m. (55 investments; the report says IRR is not meaningful for investments held less than 24 months) or leaves the cell empty (3 investments: Celtic Pharmaceutical Holdings; Markstone Capital Partners; Medica III); the multiple is blank where the report prints n.m. (18 investments with nothing contributed) and, here, for 1 investment whose contributions are negative as printed (Warburg Pincus Financial Sector III), since a multiple of negative contributions is not a return multiple; 2 rows carry a negative market value as printed. Included are 213 active investments and 165 investments the schedule marks "Liquidated" (none has a remaining market value): funds, co-investment vehicles and emerging manager vehicles (the schedule gives no strategy per row). The schedule also has 4 rows (NYCP - 2012 Emerging Manager Program; NYCP - 2015 Emerging Manager Program; NYCP - 2019 Emerging Manager Program; NYCP - Evergreen Emerging Manager Program) for program vehicles whose funds it lists one by one: the other 378 rows add up to the printed Total Portfolio ($13,668,939,880 committed, $5,838,773,651 market value), and the 213 of them not marked liquidated match the report's count of 213 active investments, so those program rows are left out rather than counted twice. Real estate, infrastructure and credit are reported separately and are not imported. View source
NYC Teachers' Retirement System: Teachers' Retirement System of the City of New York Private Equity Quarterly Report (Public): Performance Summary by Investment, as of December 31, 2025. From the Private Equity Quarterly Report (Public) in the system's quarterly investment meeting package, prepared by its private equity consultant and published by the New York City Comptroller's Bureau of Asset Management with a one-quarter lag. The schedule's column is labeled "IRR", not net or gross; the report calls the portfolio figure in that column (11.02%) the "Portfolio Net IRR, net of General Partner fees and gross of Hamilton Lane fees", and says the calculations are made by the consultant from general partners' cash flows and valuations. TVPI is the printed "Multiple" (it equals (distributed capital + market value) / paid-in capital); total value = distributed capital + market value and DPI = distributed capital / paid-in capital are computed. Contributed is the report's "Paid-In Capital" and vintage its "Vintage Year". IRR is blank where the report prints N/M (42 funded investments; the report says performance for funds with less than 8 quarters of activity is not yet meaningful) or N/A (4 funded rows, which also have no multiple: NYCTRS - 2012 Emerging Manager Program; NYCTRS - 2015 Emerging Manager Program; NYCTRS - 2019 Emerging Manager Program; NYCTRS - Evergreen Emerging Manager Program); 21 commitments have nothing paid in yet, and 4 rows carry a negative market value as printed. All 185 rows of the schedule are included, as classified by the system (buyout, growth, venture, secondaries, co-investments and emerging manager program vehicles, each program being one row without the funds it holds); they add up to its printed Total Active Investments ($16,718,215,627 committed). Exited investments are reported only as one total ($5,073,642,420 committed) and are not included, nor are the 2 commitments the report lists as closed after the as-of date. Real estate, infrastructure and credit are reported separately and are not imported. View source
New York State Common Retirement Fund: New York State Common Retirement Fund Asset Listing (Private Equity), as of March 31, 2026. The Fund's annual asset listing (fiscal year-end, March 31) reports commitment date, capital committed, capital contributed, cumulative distributions, fair value and total value for each private equity holding, in whole dollars. It reports no IRR, no multiple and no vintage year, so IRR and vintage are blank (the commitment date is not used as a vintage). Total value is the Fund's Total Value column (cumulative distributions + fair value); TVPI = total value / capital contributed and DPI = cumulative distributions / capital contributed are computed, and are blank for the 14 commitments with nothing contributed yet. All 378 rows of the Private Equity section are included, as classified by the Fund (buyout, growth, venture, co-investment and fund-of-funds vehicles, and some credit-named funds); they add up to its printed Total Private Equity Investments ($71,678,717,564 committed). 13 funds are marked by the Fund as liquidated during the fiscal year and have no remaining fair value. Not imported: one row listed after that total that is not a fund (Pursuit (formerly known as New York Business Development Corporation), $200,000,000 committed); the underlying funds of the Fund's captive funds of funds, which the listing shows separately with only a vintage year and the fund of funds' commitment (some unnamed, some in euros or pounds), while the funds of funds themselves are included; and the Opportunistic/ARS, Real Assets, Credit and Real Estate sections. View source
Orange County Employees Retirement System (OCERS): OCERS Private Equity Portfolio Summary, as of December 31, 2025. "Net IRR" and "TVPI" as printed in the "Portfolio Summary by Status" of the quarterly OCERS - Private Equity Portfolio Report that OCERS posts on its website (the report's legend names Aksia LLC as its source). The report gives every amount in $ millions to one decimal; they are converted to whole dollars here, so each is rounded to the nearest $100,000: Total Commitment, Contributions and Distributions. Total value = Distributions + NAV is computed; DPI is left blank because amounts rounded to $0.1 million do not give a reliable ratio for small funds. Vintage is the report's "Vintage Year". The report marks the IRR of investments held less than 24 months "n.m." (not meaningful); 64 funds have no IRR (n.m., or "-" for commitments with nothing contributed yet) and 17 have no TVPI, all shown as blank. 12 funds' values are marked by the report as adjusted for contributions and distributions since the last valuation, which is before the report date. All 237 funds in the report are included: 211 active and 26 liquidated (no remaining NAV), adding up to the report's printed totals of $6.90 billion committed, $5.09 billion contributed and $5.39 billion NAV. OCERS's private equity portfolio as it reports it includes funds of funds, secondaries, co-investments and a few private credit funds; its separate Real Assets and Real Estate summaries are not imported. View source
Pennsylvania PSERS: PSERS Private Markets Combined Portfolio Report (Private Equity Active Partnerships), as of December 31, 2025. "ITD Net IRR" (inception to date) and TVPI as labeled by PSERS in a report prepared by its private markets consultant, Aksia, which says fund IRRs are as reported by the manager or administrator, or calculated from the cash flows they provide, and may benefit from a fund's use of a subscription line. PSERS marks the IRR not meaningful (n.m., shown as blank) for investments held less than 12 months. Dollar amounts are reported in $ millions to one decimal and converted to whole dollars. Total value = distributions + NAV and DPI = distributions / contributions are computed from those rounded amounts; TVPI is as printed (blank where nothing has been contributed). Active private equity partnerships only: PSERS reports liquidated partnerships and co-investments only as totals, and its real estate, credit, infrastructure and commodities partnerships are not included. 5 partnerships carry a NAV PSERS flags as not up to date. View source
Public School and Education Employee Retirement Systems of Missouri (PSRS/PEERS): PSRS/PEERS Annual Comprehensive Financial Report: Private Equity Partnerships, as of June 30, 2025. Holdings only: the Private Equity Partnerships table of the Systems' Annual Comprehensive Financial Report lists each manager's fund family on one row, naming the funds held together (for example several consecutive funds of one series), with an investment strategy and one combined "Fair Value" at the June 30 fiscal year-end, shown here as the market value in whole dollars as printed. The report says the Systems were invested in 278 separate partnerships with 91 firms in the Private Equity asset class; the table has 104 rows, so a row can stand for several partnerships and its value is their total. It reports no commitment, contributions, distributions, vintage year, multiple or IRR per row, so committed, paid-in, distributed, total value, IRR, TVPI and DPI are blank; nothing is derived or estimated. The report says fair values are reported by the Systems' private equity advisors and reflect the most current net asset values, cash-flow adjusted through June 30 where a net asset value was older. Every partnership row is included as classified by the Systems (8 Venture Capital, 8 debt-related (distressed, opportunistic, mezzanine) and 1 Fund-of-Funds, the discretionary fund-of-funds relationship reported under its manager's name, alongside acquisition, special situations and secondary funds); the table's "Stock distribution account" and "Cash and Equivalents" rows are left out. The rows add up to the table's printed Total of $10,632,702,691. The separate Private Credit and Private Real Estate partnership tables are not imported. View source
Pennsylvania SERS: SERS Quarterly Private Equity Board Update, Schedule of Investments by Sector, as of December 31, 2025. IRR and TVM (total value multiple) as reported by SERS in a quarterly update prepared by StepStone Group. The schedule's column is headed "IRR"; the report says "Net IRR is net of managers' fees, expenses, and carried interest" and that, unless otherwise indicated, performance is net of fees and expenses charged by the underlying investment but gross of StepStone vehicle/account fees and expenses. It also says the figures were prepared by StepStone on behalf of SERS and not provided by any general partner, and that IRR and TVM for certain vehicles may have been impacted by subscription-backed credit facilities. Total value = market value + distributions; TVPI is SERS's TVM recomputed to two decimals from the reported amounts (SERS prints one decimal) and DPI = distributions / contributions is computed. SERS marks some partnerships NM ("Not Meaningful", no rule stated) and leaves the TVM and IRR cells, and usually the market value, empty for 29 others; those fields are blank here. Covers the buyout, growth equity and special situations partnerships on the schedule; the Keystone Legacy Fund line (SERS's pooled non-core legacy funds) and the separate legacy private credit schedule are not included. Commitments to non-USD funds reflect current exchange rates. View source
State of Wisconsin Investment Board (SWIB): SWIB Retirement Funds Schedule of Investments: Private Fund Investments, as of December 31, 2025. Holdings only: the Private Fund Investments section of SWIB's annual Retirement Funds Schedule of Investments lists each private fund held by the Core Retirement Investment Trust Fund with only its "Fair Value" at December 31, shown here as the market value in whole dollars as printed. It reports no commitment, contributions, distributions, vintage year, multiple or IRR per fund, so committed, paid-in, distributed, total value, IRR, TVPI and DPI are blank; nothing is derived or estimated. The section is not limited to private equity and venture capital: SWIB's annual report says Private Fund Investments include private equity (it names leveraged buyout, growth equity, venture capital, distressed debt, private debt and secondaries strategies) and real estate (core, value and opportunistic), and the list includes real estate holdings under the name of a property, joint venture or separate account. The schedule does not say which asset class a fund belongs to, so all 600 named funds are included, with names as printed (capitals, abbreviated); 7 funds have a negative fair value, as printed. Left out are the section's aggregate rows, which are not funds: "CO-INVESTMENTS (in aggregate)" ($3,595,953,422) and "VENTURE CAPITAL SECURITIES (in aggregate)" ($2,939,449,212). With them the rows add up to the printed TOTAL PRIVATE FUND INVESTMENTS of $36,927,086,083. Hedge funds are in the schedule's Multi Asset and Other section, which is not imported. View source
Texas Municipal Retirement System: TMRS Private Investment Performance Since Inception (Private Equity), as of June 30, 2026. "Percentage Return" since inception as printed by TMRS for funds whose "Performance Methodology" is "IRR" (internal rate of return). TMRS does not label the IRR net or gross and does not say how or by whom it is calculated or when it is not meaningful, so IRRs of very young funds are shown as printed; it states that the information has not been prepared or approved by any manager or general partner and may not reflect their records. TMRS prints no multiple: total value = amount received + remaining value, TVPI = total value / amount invested and DPI = amount received / amount invested are computed from the reported whole-dollar columns. TMRS lists the date(s) of investment (the dates its commitments were completed, matching its Completed Investments Report) rather than a vintage year; the year of the earliest date is used as the vintage. 3 commitments are stated in euros and their committed amount is left blank (the invested, received and remaining amounts are in dollars). 9 commitments have nothing invested yet and so no IRR or multiples. 1 funded holding has no IRR because TMRS prints no return, or a time-weighted return, for it. Private Equity section only (as classified by TMRS; it includes venture, growth, buyout, co-investments and separately managed accounts); the Credit, Global Equity, Real Assets, Tactical Opportunities and Multi Asset Class sections are not imported. View source
UTIMCO (Permanent University Fund): Permanent University Fund Detail Schedules of Investment Securities, Schedule H: Private Investment Funds, as of August 31, 2025. Holdings only: the audited Schedule H lists each private investment fund held by the Permanent University Fund, which UTIMCO manages, with its fair value at the August 31 fiscal year end and nothing else, so vintage year, commitment, contributions, distributions, total value, IRR and multiples are blank (UTIMCO reports none of them here); each fund's fair value is kept as market_value_usd in whole dollars as printed. Fund names are as printed (capitals, abbreviated). Included are the schedule's Private Equity (159 funds), Venture (165) and Emerging Market Equity (29) sections; its Credit, Infrastructure, Natural Resources and Real Estate sections are not imported, and neither are 24 direct investments in the imported sections, which UTIMCO lists only as numbered "Direct Investment" rows because their names are confidential under Texas Government Code 552.143(c). Covers the Permanent University Fund only: UTIMCO publishes no such schedule for the General Endowment Fund, and it provides its fund-level Private Markets performance reports only in answer to an open records request. View source
Washington State Investment Board: WSIB Private Equity Portfolio Performance Summary By Strategy, as of March 31, 2026. Net IRR as labeled by WSIB, calculated by Hamilton Lane from general partner cash flows and valuations and not confirmed by the general partners. TVPI is WSIB's total value multiple (B+C)/A recomputed to two decimals from the reported totals (WSIB prints one decimal). WSIB lists an initial investment date rather than a vintage year; its year is used as the vintage (blank for commitments not yet funded). Includes realized and legacy partnerships. View source
About this data
Fund sizes come from firm announcements, SEC filings, and press reports, converted to US dollars near the closing date. Compiled as of October 9, 2026. Notable portfolio companies are examples from public sources, not a complete list.
Share this page
For a post, a deck, or a note to your partners: image (PNG) · vector (SVG).