Spark Capital
Also known as Spark
Boston, United States Founded 2005 sparkcapital.com Boston ecosystem (#4 of 32)
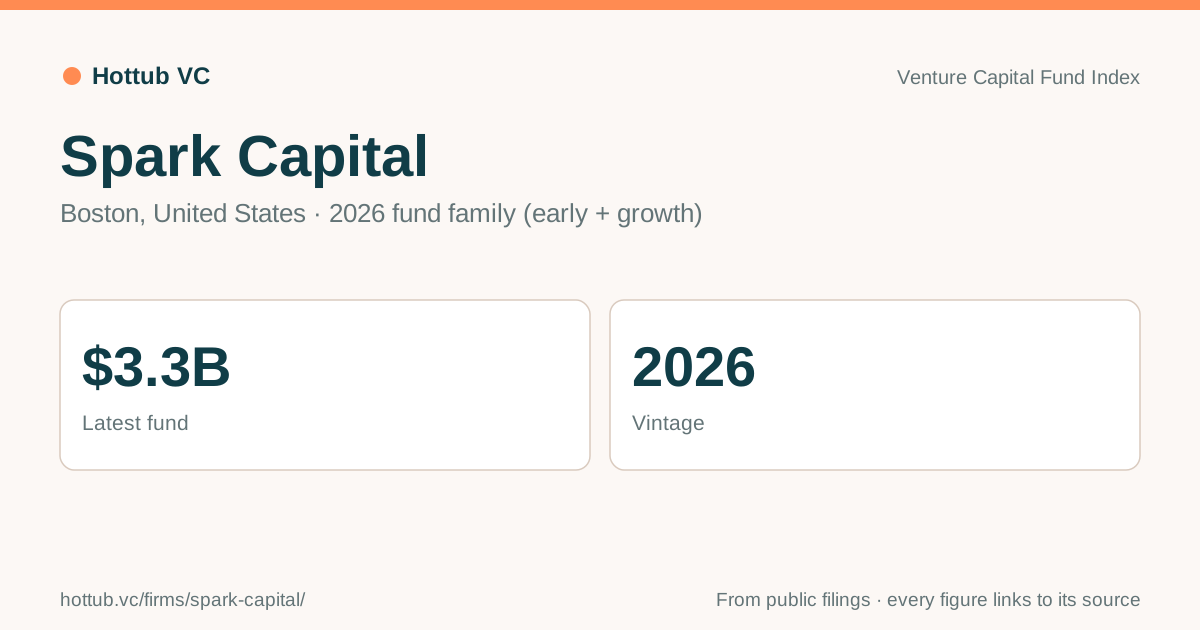
Spark Capital’s latest fund is 2026 fund family (early + growth): $3.3B, 2026, #16 of 427 firms by latest fund.
Updates from Spark Capital
Overview
The only source is the firm's own X post (June 2026). No breakdown between early and growth funds was given. The prior family (Spark Capital VIII + Spark Growth V) totaled $2.3B.
Funds
| Fund | Closed | Size | Source |
|---|---|---|---|
| 2026 fund family (early + growth) | 2026 | $3.3B | x.com |
LPs on the record
12 private foundations list on their latest IRS Form 990-PF, and 13 other LPs report holding Spark Capital’s funds.
- Los Angeles City Employees' Retirement System (LACERS)
- Hillman Family Foundations
- Orange County Employees Retirement System (OCERS)
22 more LPs are in the app. Find LPs that back firms like this one in Hottub’s LP Intelligence: ranked by overlap, with what each holds and how to reach it.
Firms whose LPs overlap
The firms sharing the most LPs on record with Spark Capital, relative to how many LPs each has. A peer set like this is what Find LPs ranks LPs from.
Find LPs for Spark Capital and these firms: Hottub ranks the LPs that hold their funds, the ones still adding funds first.
Track record
A score of 75 out of 100 from 9 of the 14 funds public LPs report, 7 of them in the top half of their vintage. Its ranked funds’ median TVPI is 2.30x and median DPI 1.77x. Pooled where reports give cash flows: 2.59x TVPI, 0.91x DPI. That ranks it 3rd of 123 managers with a score.
Each fund once, as the latest of 8 LPs’ reports ranks it by TVPI against funds of the same vintage in those reports; 50 is the median fund, and a short record is pulled toward 50. The full record in LP Intelligence, with each fund’s rank and what usually follows a fund like its latest, or every manager’s.
Reported fund performance
As reported by public LPs that invested in these funds, net of fees. “Versus vintage” ranks each fund against every other fund of the same vintage in that LP’s report, mostly private equity and venture funds. Open a fund for its cash flows and full peer ranking.
| Fund | Vintage | Net IRR | Versus vintage (IRR) | TVPI | DPI | Reported by |
|---|---|---|---|---|---|---|
| Spark Capital Fund VIII | 2024 | -3.9% | Third quartile | 0.98x | 0.00x | CalSTRS |
| Spark Capital Growth Fund V | 2024 | N/M | — | — | Employees' Retirement System of the State of Hawaii (HIERS), Los Angeles City Employees' Retirement System (LACERS), Orange County Employees Retirement System (OCERS), Alaska Permanent Fund Corporation (APFC), CalSTRS | |
| Spark Capital VIII | 2024 | N/M | — | — | Employees' Retirement System of the State of Hawaii (HIERS), Los Angeles City Employees' Retirement System (LACERS), Orange County Employees Retirement System (OCERS), Alaska Permanent Fund Corporation (APFC) | |
| Spark Capital Growth Fund IV | 2021 | 43.6% | Top quartile | 2.29x | 0.00x | Los Angeles City Employees' Retirement System (LACERS), Orange County Employees Retirement System (OCERS) |
| Spark Capital VII | 2021 | 19.7% | Top quartile | 1.57x | 0.00x | Los Angeles City Employees' Retirement System (LACERS), Orange County Employees Retirement System (OCERS) |
| Spark Capital Growth Fund III | 2020 | 21.4% | Top quartile | 2.29x | 0.19x | Los Angeles City Employees' Retirement System (LACERS), Orange County Employees Retirement System (OCERS) |
| Spark Capital VI | 2020 | 7.8% | Bottom quartile | 1.37x | 0.00x | Los Angeles City Employees' Retirement System (LACERS), Orange County Employees Retirement System (OCERS) |
| Spark Capital Growth Fund II | 2017 | 16.5% | Second quartile | 1.99x | 1.29x | Los Angeles City Employees' Retirement System (LACERS) |
| Spark Capital Growth Fund | 2014 | 28.3% | Top quartile | 6.12x | 2.99x | Los Angeles City Employees' Retirement System (LACERS) |
| Spark Capital IV | 2013 | N/M | — | — | Alaska Permanent Fund Corporation (APFC) | |
| Spark Capital III | 2011 | 23.9% | Top quartile | 3.40x | 1.77x | Los Angeles City Employees' Retirement System (LACERS) |
| Spark Capital II | 2008 | 51.4% | Top quartile | 5.42x | 4.90x | Los Angeles City Employees' Retirement System (LACERS) |
| Spark Capital | 2005 | 7.8% | Second quartile | 1.37x | 1.35x | Los Angeles City Employees' Retirement System (LACERS) |
| SPARK CAPITAL II | — | N/M | — | — | UTIMCO (Permanent University Fund) | |
| Spark Capital VIII | — | N/M | — | — | South Carolina Retirement System Investment Commission (RSIC) | |
| Spark Capital VIII, Growth Fund V | — | N/M | — | — | Public School and Education Employee Retirement Systems of Missouri (PSRS/PEERS) | |
| Spark Growth V | — | N/M | — | — | South Carolina Retirement System Investment Commission (RSIC) |
Alaska Permanent Fund Corporation (APFC): APFC Private Equity Report: Private Equity Fund Commitments & Direct Investments / Co-Investments, as of December 31, 2025. APFC's quarterly Private Equity report ("Private Equity Fund Commitments & Direct Investments / Co-Investments") lists each fund with only its currency, "Vintage Year" and "Commitment (USD)", shown here in whole US dollars as printed. It reports no contributions, distributions, market value, multiple or IRR per fund, so paid-in, distributed, total value, IRR, TVPI and DPI are blank; nothing is derived or estimated. All 454 entries of the report's "Fund Investments" list are included ($17,570,561,197 committed); 15 have the vintage year "TBD" (blank here) and 45 are commitments in another currency that APFC states in US dollars. The report's separate "Direct Investments / Co-Investments" list (56 entries, $2,792,151,600: portfolio companies, co-investment vehicles and manager stakes) is not imported. The two lists add up to the report's printed Total Commitments of $20,362,712,795. For the whole portfolio, including liquidated investments, the report prints Cumulative Contributions of $20,951,089,446, Cumulative Distributions of $22,493,801,627 and a Remaining Fair Market Value of $15,555,575,745. APFC is a state-owned corporation that manages the Alaska Permanent Fund, not a pension plan; its separate Private Income report is not imported. View source
CalSTRS: CalSTRS Private Equity Portfolio Performance, as of June 30, 2025. Since-inception IRR as calculated by CalSTRS from its own cash flows with each partnership; CalSTRS does not label it net or gross; because it is computed from CalSTRS's own contributions and distributions, it is after the partnership's fees and carried interest. CalSTRS says IRRs in a partnership's first three years are not meaningful. CalSTRS reports no multiple: TVPI = (distributed + market value) / contributed and DPI = distributed / contributed are computed. IRR is blank for commitments with no capital contributed. View source
Employees' Retirement System of the State of Hawaii (HIERS): HIERS Private Equity Partnerships: Performance Summary by Investment, as of March 31, 2026. ERS posts a quarterly "Performance Summary by Investment" of its private equity partnerships in which only "Capital Committed", "Paid-In Capital" and "Reported Market Value" (with the date of that value) are filled in; the Capital Distributed, Remaining Cost, Net IRR and TVM columns are empty in the published version. So committed, paid-in and market value are shown, in whole US dollars as printed, and distributed, total value, IRR, TVPI and DPI are blank; nothing is derived or estimated. The report says paid-in capital includes both commitment and non-commitment reducing capital calls, that cash flows are HIERS' actual cash paid and received, and that market values reflect HIERS' unrealized interest in each investment. "Vintage Year" is as printed. All 371 investments are included as ERS classifies them by strategy (61 Buyout - Large, 42 Buyout - Mega, 59 Buyout - Mid, 13 Buyout - Small, 3 Co/Direct Investment, 6 Distressed Debt, 40 Growth Equity, 10 Mezzanine, 2 Secondaries, 10 Special Situations, 125 Venture Capital), in the report's blocks: Core (334), Stafford Capital Management - 1 (8), Stafford Capital Management - 2 (11), Stafford Capital Management - 3 (17), Stafford Ho'oulu Fund (1); the Stafford Capital Management blocks list the partnerships held through the Hawaii Targeted Investment Program funds (HiTIP I, II and III) that ERS's Holdings page also reports separately. They add up to the printed Grand Total of $8,371,769,464 committed, $6,707,086,129 paid in and $5,197,639,074 reported market value. 114 investments have no remaining value (liquidated, or not yet called), shown as 0; 9 others carry a value dated before the report date. Each page of the report carries the legend "Institutional Use Only/Not for Public Use | Proprietary and Confidential"; this is the version ERS itself posts on its Holdings page. ERS's separate private credit, real assets and timber reports are not imported. View source
Los Angeles City Employees' Retirement System (LACERS): LACERS Private Equity Portfolio Performance Report, as of December 31, 2025. "Net IRR" and "Net TVPI" as printed in the fund-by-fund appendix of the Private Equity Portfolio Performance Report that LACERS posts semiannually (prepared on its private equity consultant's template; the cover gives www.aksia.com). The report defines TVPI as (cumulative distributions + fair market value) / cumulative contributions and labels IRRs of investments held less than two years "n.m."; 27 funds have no IRR (n.m., or "-" in the report) and 14 have no multiple ("-", mostly commitments with nothing contributed yet), all shown as blank. Dollar amounts are whole US dollars as reported (inception-to-date contributions and distributions). Total value = distributions + fair market value, and DPI = distributions / contributions, are computed. All 408 partnerships in the report are included: 305 active and 103 liquidated (no remaining fair market value), of which 23 are in LACERS' Specialized Portfolio and the rest in its Core Portfolio. LACERS counts 36 Credit/Distressed and 15 Natural Resources (energy) partnerships as private equity in this report, alongside buyout, growth equity, venture capital, secondaries, co-investment and fund-of-funds vehicles; its separate private credit and real estate reports are not imported. View source
Orange County Employees Retirement System (OCERS): OCERS Private Equity Portfolio Summary, as of December 31, 2025. "Net IRR" and "TVPI" as printed in the "Portfolio Summary by Status" of the quarterly OCERS - Private Equity Portfolio Report that OCERS posts on its website (the report's legend names Aksia LLC as its source). The report gives every amount in $ millions to one decimal; they are converted to whole dollars here, so each is rounded to the nearest $100,000: Total Commitment, Contributions and Distributions. Total value = Distributions + NAV is computed; DPI is left blank because amounts rounded to $0.1 million do not give a reliable ratio for small funds. Vintage is the report's "Vintage Year". The report marks the IRR of investments held less than 24 months "n.m." (not meaningful); 64 funds have no IRR (n.m., or "-" for commitments with nothing contributed yet) and 17 have no TVPI, all shown as blank. 12 funds' values are marked by the report as adjusted for contributions and distributions since the last valuation, which is before the report date. All 237 funds in the report are included: 211 active and 26 liquidated (no remaining NAV), adding up to the report's printed totals of $6.90 billion committed, $5.09 billion contributed and $5.39 billion NAV. OCERS's private equity portfolio as it reports it includes funds of funds, secondaries, co-investments and a few private credit funds; its separate Real Assets and Real Estate summaries are not imported. View source
Public School and Education Employee Retirement Systems of Missouri (PSRS/PEERS): PSRS/PEERS Annual Comprehensive Financial Report: Private Equity Partnerships, as of June 30, 2025. Holdings only: the Private Equity Partnerships table of the Systems' Annual Comprehensive Financial Report lists each manager's fund family on one row, naming the funds held together (for example several consecutive funds of one series), with an investment strategy and one combined "Fair Value" at the June 30 fiscal year-end, shown here as the market value in whole dollars as printed. The report says the Systems were invested in 278 separate partnerships with 91 firms in the Private Equity asset class; the table has 104 rows, so a row can stand for several partnerships and its value is their total. It reports no commitment, contributions, distributions, vintage year, multiple or IRR per row, so committed, paid-in, distributed, total value, IRR, TVPI and DPI are blank; nothing is derived or estimated. The report says fair values are reported by the Systems' private equity advisors and reflect the most current net asset values, cash-flow adjusted through June 30 where a net asset value was older. Every partnership row is included as classified by the Systems (8 Venture Capital, 8 debt-related (distressed, opportunistic, mezzanine) and 1 Fund-of-Funds, the discretionary fund-of-funds relationship reported under its manager's name, alongside acquisition, special situations and secondary funds); the table's "Stock distribution account" and "Cash and Equivalents" rows are left out. The rows add up to the table's printed Total of $10,632,702,691. The separate Private Credit and Private Real Estate partnership tables are not imported. View source
South Carolina Retirement System Investment Commission (RSIC): RSIC Annual Investment Report: Schedule of Investments, Private Equity, as of June 30, 2025. The Schedule of Investments in RSIC's Annual Investment Report (its "Manager Returns" chapter) lists each private equity investment with a "Market Value" (shown here, in whole dollars as printed), its share of the plan, and 1-, 3-, 5- and 10-year returns. The report describes those returns as "time-weighted, total return, net of fees and expenses" and says a time-weighted methodology may not be an appropriate performance measure for private markets investments; they are not IRRs and are not shown. The schedule gives no commitment, contributions, distributions, vintage year or multiple per fund, so committed, paid-in, distributed, total value, IRR, TVPI and DPI are blank; nothing is derived or estimated. All 140 investments under the schedule's "Private Equity" heading are included with the names as RSIC abbreviates them (buyout, growth, venture, secondaries, co-investment vehicles and strategic-partnership accounts), including 1 printed with a dash for market value (kept as zero). They add up to the section's printed market value of $6,705,081,401. The Private Debt, Real Assets (infrastructure and real estate) and other sections of the schedule are not imported. View source
UTIMCO (Permanent University Fund): Permanent University Fund Detail Schedules of Investment Securities, Schedule H: Private Investment Funds, as of August 31, 2025. Holdings only: the audited Schedule H lists each private investment fund held by the Permanent University Fund, which UTIMCO manages, with its fair value at the August 31 fiscal year end and nothing else, so vintage year, commitment, contributions, distributions, total value, IRR and multiples are blank (UTIMCO reports none of them here); each fund's fair value is kept as market_value_usd in whole dollars as printed. Fund names are as printed (capitals, abbreviated). Included are the schedule's Private Equity (159 funds), Venture (165) and Emerging Market Equity (29) sections; its Credit, Infrastructure, Natural Resources and Real Estate sections are not imported, and neither are 24 direct investments in the imported sections, which UTIMCO lists only as numbered "Direct Investment" rows because their names are confidential under Texas Government Code 552.143(c). Covers the Permanent University Fund only: UTIMCO publishes no such schedule for the General Endowment Fund, and it provides its fund-level Private Markets performance reports only in answer to an open records request. View source
About this data
Fund sizes come from firm announcements, SEC filings, and press reports, converted to US dollars near the closing date. Compiled as of October 9, 2026. Notable portfolio companies are examples from public sources, not a complete list.
Share this page
For a post, a deck, or a note to your partners: image (PNG) · vector (SVG).